Part one is UIKit and AppKit: the code you write, the process it sets off, and what Apple says about it. Part two is SwiftUI: what Apple says, the code, and then three platforms measured against each other. A picture follows nearly every paragraph, and every claim says how it is known.
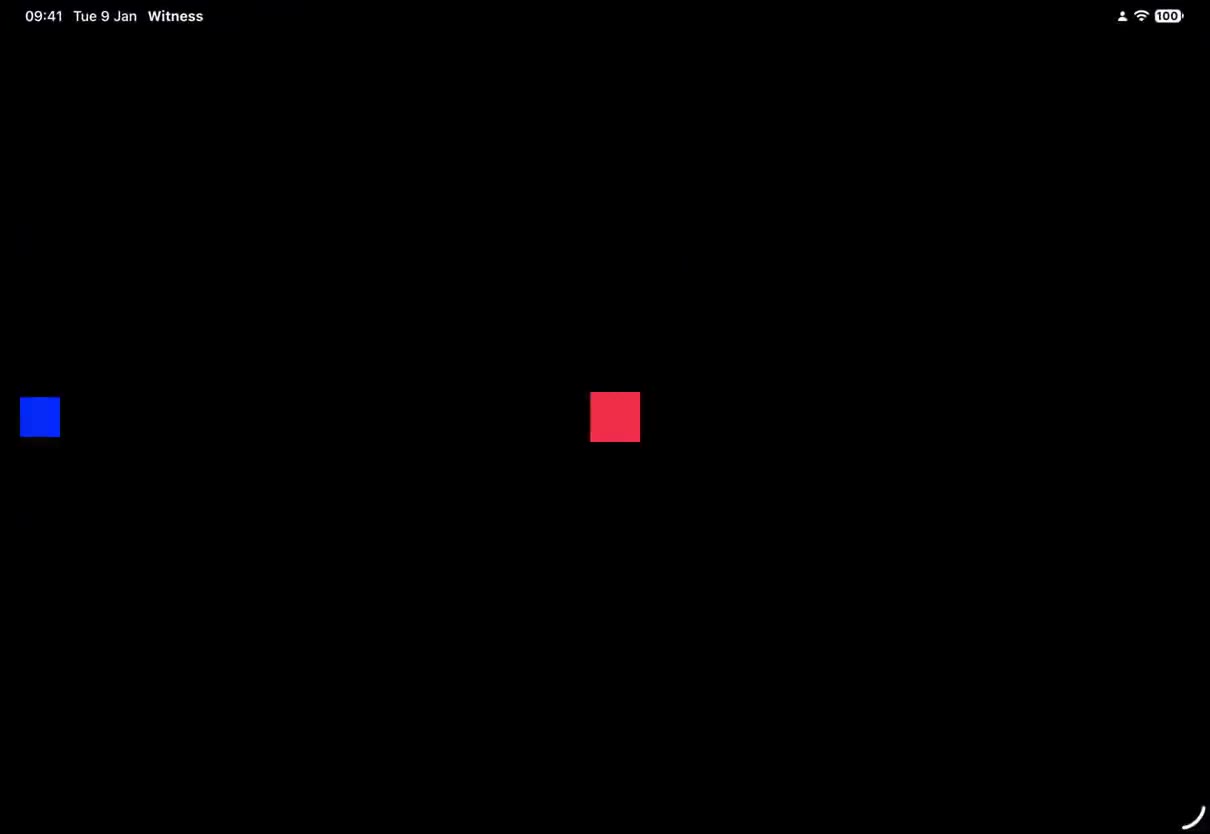
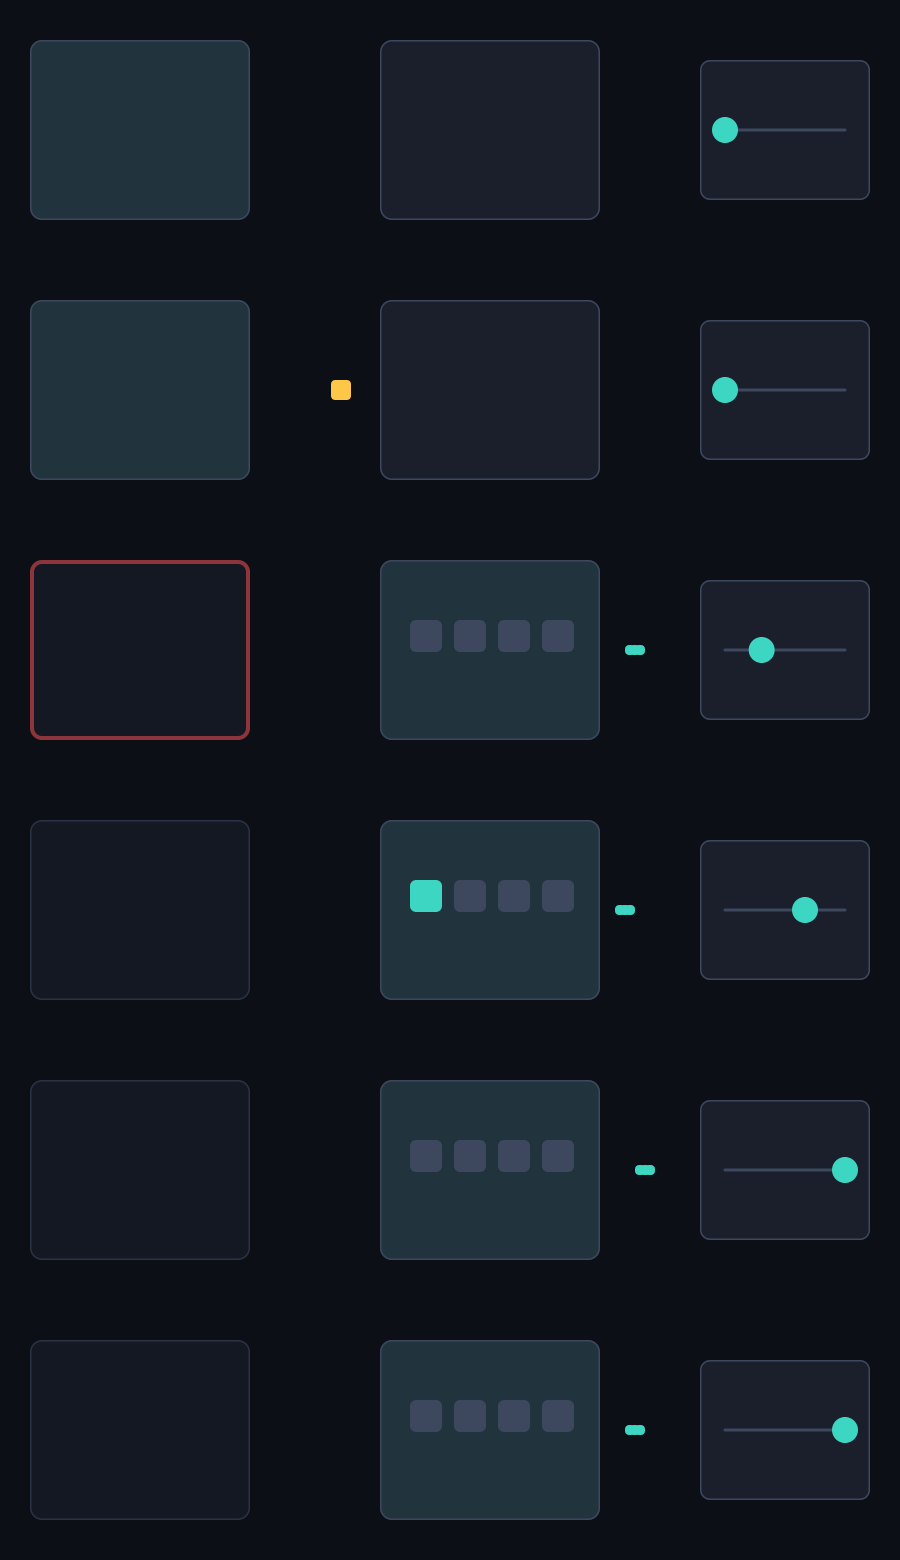
A real iPad Pro, recorded over USB. My test app, the probe described below, lights a blue square around the time it blocks the main thread (lit about 0.6 s, the block is its last 0.5 s), and here it is lit. The SwiftUI dot is still moving.
Welcome. Issue 1 drew the map and issue 2 proved one small piece of Core Graphics. This issue takes one thing you do every day, animate a view, and follows it from your line of code to the pixels, in two frameworks that look alike and are not.
flowchart LR
  start["one dot,<br/>moved across a view"] --> k["UIKit or AppKit"]
  start --> s["SwiftUI"]
  k --> same["looks the same<br/>on screen"]
  s --> same
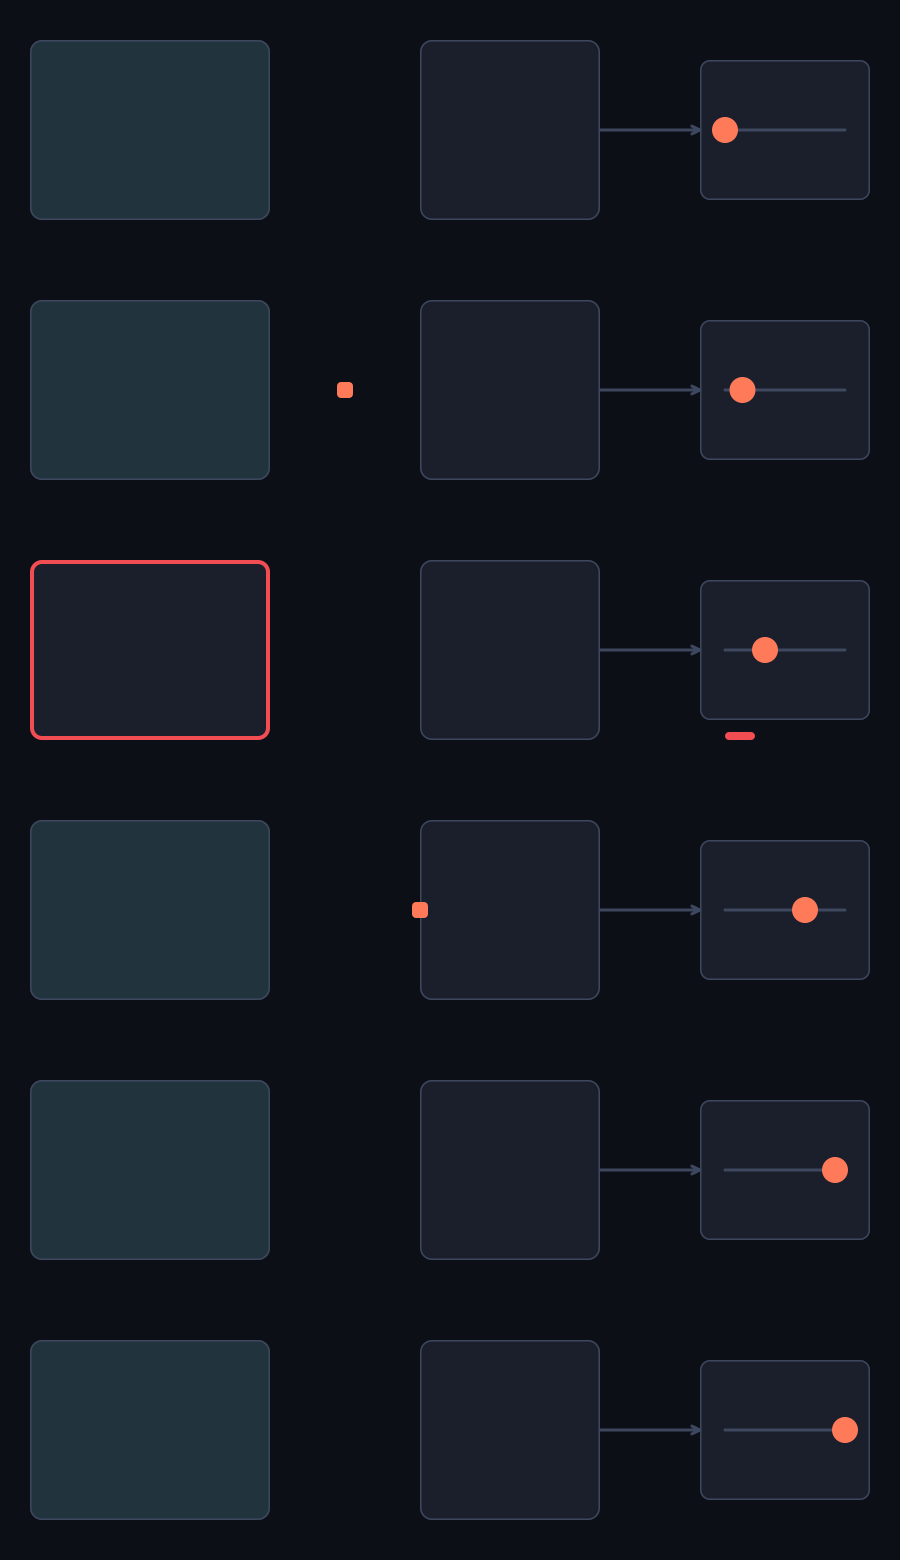
The test case is one dot. Move it across a view, once with UIKit or AppKit and once with SwiftUI (half a second for the instrumented cases, 2.4 s for the recordings of the dot). On screen the two look the same. Underneath they are different machines, and the SwiftUI machine is different again on a Mac and on an iPhone. Here are the recordings of the real iPad, one for each animation, redrawn from the measured dot positions and shown together at half speed, with the framework’s own animation on the top row and SwiftUI on the bottom.

How to read this issue
Every claim carries one of six labels, in words, near the claim: documented (Apple’s own document, session or SDK, which I name), measured (my probe ran it and the number is in a table or chart here), observed (read from a call stack, a breakpoint, a sample or a captured message while it ran), read from code (from a disassembly, so it shows what a function can do and not what it did), my reading (an inference, said to be one) and open (I do not know).
flowchart LR
  c["a claim"] --> d["documented"]
  c --> m["measured"]
  c --> o["observed"]
  c --> r["read from code"]
  c --> y["my reading"]
  c --> q["open"]
The probe is a small app. A view holds a stack of two colours, so that opacity is a property of the layer and not colour alpha inside a drawing. One property is driven at a time: opacity, offset, width, scale or rotation. Four kinds of animation: linear 0.5 s, ease in and out 0.5 s, a spring with duration 0.5 and bounce 0.3, and a custom callback. That is 20 SwiftUI cases per platform, and the same properties move with the framework’s own call as the control.
| Property | SwiftUI, from and to | UIKit and AppKit control |
|---|---|---|
| opacity | 0.2 and 1 | alpha or alphaValue set to 0.2 |
| offset | 0 and 90 points across | center.x or frame.origin.x plus 90 |
| width | 20 and 100 points | bounds.size.width or frame.size.width set to 100 |
| scale | 1 and 1.5 | transform scaled 1.5 (UIKit only) |
| rotation | 0 and 90 degrees | transform rotated a quarter turn (UIKit only) |
The platforms are macOS 27.0.1, an iPhone simulator and an iPad simulator (27.0), a real iPhone 17 Pro Max and a real iPad Pro 11-inch M4 (27.2). Everything below is from those runs unless it says otherwise.
| Platform | Version | Real or simulated | Refresh |
|---|---|---|---|
| Mac | macOS 27.0.1 | real | 60 Hz |
| iPhone | 27.0 | simulator | 60 Hz |
| iPad | 27.0 | simulator | 60 Hz |
| iPhone 17 Pro Max | 27.2 | real | reports 120 Hz, ran at about 60 |
| iPad Pro 11-inch M4 | 27.2 | real | 120 Hz |
On the real iPhone the passes of the custom callback (a pass is defined in “The three platforms, side by side”) ran at about 60 a second for four of five properties, and offset had more callbacks and flushes than the simulator’s. The probe sets no ProMotion key, which I have not confirmed as the cause; “The three platforms, side by side” has the numbers.
Part one: UIKit and AppKit
The code
This is the probe’s own code for the UIKit control. One switch on the property, and an animation block around it.
static func trigger(_ property: Property, _ kind: Kind, view: UIView) {
    let change = {
        switch property {
        case .opacity: view.alpha = 0.2
        case .offset: view.center.x += 90
        case .width: view.bounds.size.width = 100
        case .scale: view.transform = CGAffineTransform(scaleX: 1.5, y: 1.5)
        case .rotation: view.transform = CGAffineTransform(rotationAngle: .pi / 2)
        }
    }
    switch kind {
    case .linear: UIView.animate(withDuration: 0.5, delay: 0, options: .curveLinear, animations: change)
    case .easeInOut: UIView.animate(withDuration: 0.5, delay: 0, options: .curveEaseInOut, animations: change)
    case .spring: UIView.animate(springDuration: 0.5, bounce: 0.3, delay: 0, options: [], animations: change)
    case .custom: break
    }
}
Look at what the code does not say. It says nothing about frames. It sets the final value, alpha = 0.2, inside a block, and tells the system how long to take.
flowchart LR
  you["you give:<br/>the end value<br/>and a duration"] --> sys["the system<br/>supplies:<br/>every frame between"]
The AppKit control, which I ran on the Mac, has the same shape: a group with a duration and a timing function, and the change made through the view’s animator() proxy.
static func trigger(_ property: Property, _ kind: Kind, view: NSView) {
    NSAnimationContext.runAnimationGroup { context in
        context.duration = 0.5
        context.timingFunction = CAMediaTimingFunction(name: kind == .linear ? .linear : .easeInEaseOut)
        switch property {
        case .opacity: view.animator().alphaValue = 0.2
        case .offset: view.animator().frame.origin.x += 90
        case .width: view.animator().frame.size.width = 100
        case .scale, .rotation: break
        }
    }
}
flowchart LR g["runAnimationGroup<br/>duration 0.5"] --> a["view.animator()<br/>.alphaValue = 0.2"] --> r["the view animates<br/>instead of popping"]
AppKit has gaps that UIKit does not, and the probe records each as unsupported, with its reason. The caller asks AppKitBaseline.unsupported(property, kind) first, so the trigger shown above is reached only by the cases it does not refuse. From the API on the Mac, and so not run: there is no animator for a layer transform, so scale and rotation are not animated this way (8 of the 20 cases; NSView has rotation properties of its own, which the probe did not use); the classic NSAnimationContext group has no spring (3 more, for opacity, offset and width); and the NSAnimationContext group the probe used has no callback for a value (3 more; NSAnimation has a delegate method that supplies a value for a progress, which the probe did not use). That leaves 6 AppKit cases that run, against 15 for UIKit, whose classic block animations have no callback either, and 20 for SwiftUI. These counts hold for the classic calls the probe used. On macOS 15 and later NSAnimationContext.animate(_:changes:completion:) takes a SwiftUI Animation (documented), which includes springs and custom animations, and the probe did not use it.
Underneath both is Core Animation. If you wrote the opacity animation by hand, it would look like this. It is a sketch of the public API, not the probe’s code.
let fade = CABasicAnimation(keyPath: "opacity")
fade.fromValue = 1.0
fade.toValue = 0.2
fade.duration = 0.5
fade.timingFunction = CAMediaTimingFunction(name: .linear)

layer.opacity = 0.2                  // the model value changes now
layer.add(fade, forKey: "fade")      // the animation is handed to the layer
Two lines at the end. One sets the value. One hands over a description. Hold that picture: an animation is an object you give to a layer. This sketch is mine, not from the probe, and I never ran it. My understanding is that it is exact for the layer that backs a view, where the layer’s own implicit animation is switched off outside an animation block; on a standalone layer, setting layer.opacity also fires the layer’s default implicit animation, so there the sketch is exact only with actions disabled.
flowchart TB
  layer["a layer"]
  layer --- v["holds a value:<br/>opacity 0.2"]
  layer --- o["holds an object:<br/>the animation<br/>keyed fade"]
What Apple documents
The three trees
The Core Animation Programming Guide (Apple, updated 2015), in the section “Layer Trees Reflect Different Aspects of the Animation State”, says an app using Core Animation has three sets of layer objects. The model layer tree is where your app works: its objects “store the target values for any animations”, and “whenever you change the property of a layer, you use one of these objects”. The presentation tree contains “the in-flight values for any running animations”, the values “as they appear onscreen”. You never modify it. You read it, for example “to create a new animation starting at those values”. The render tree is where the work happens: its objects “perform the actual animations and are private to Core Animation”.
flowchart LR
  model["model layer tree<br/>target values<br/>you write here"]
  pres["presentation tree<br/>in-flight values<br/>you only read here"]
  render["render tree<br/>performs the animations<br/>private"]
  model --> render
  model -.-> pres
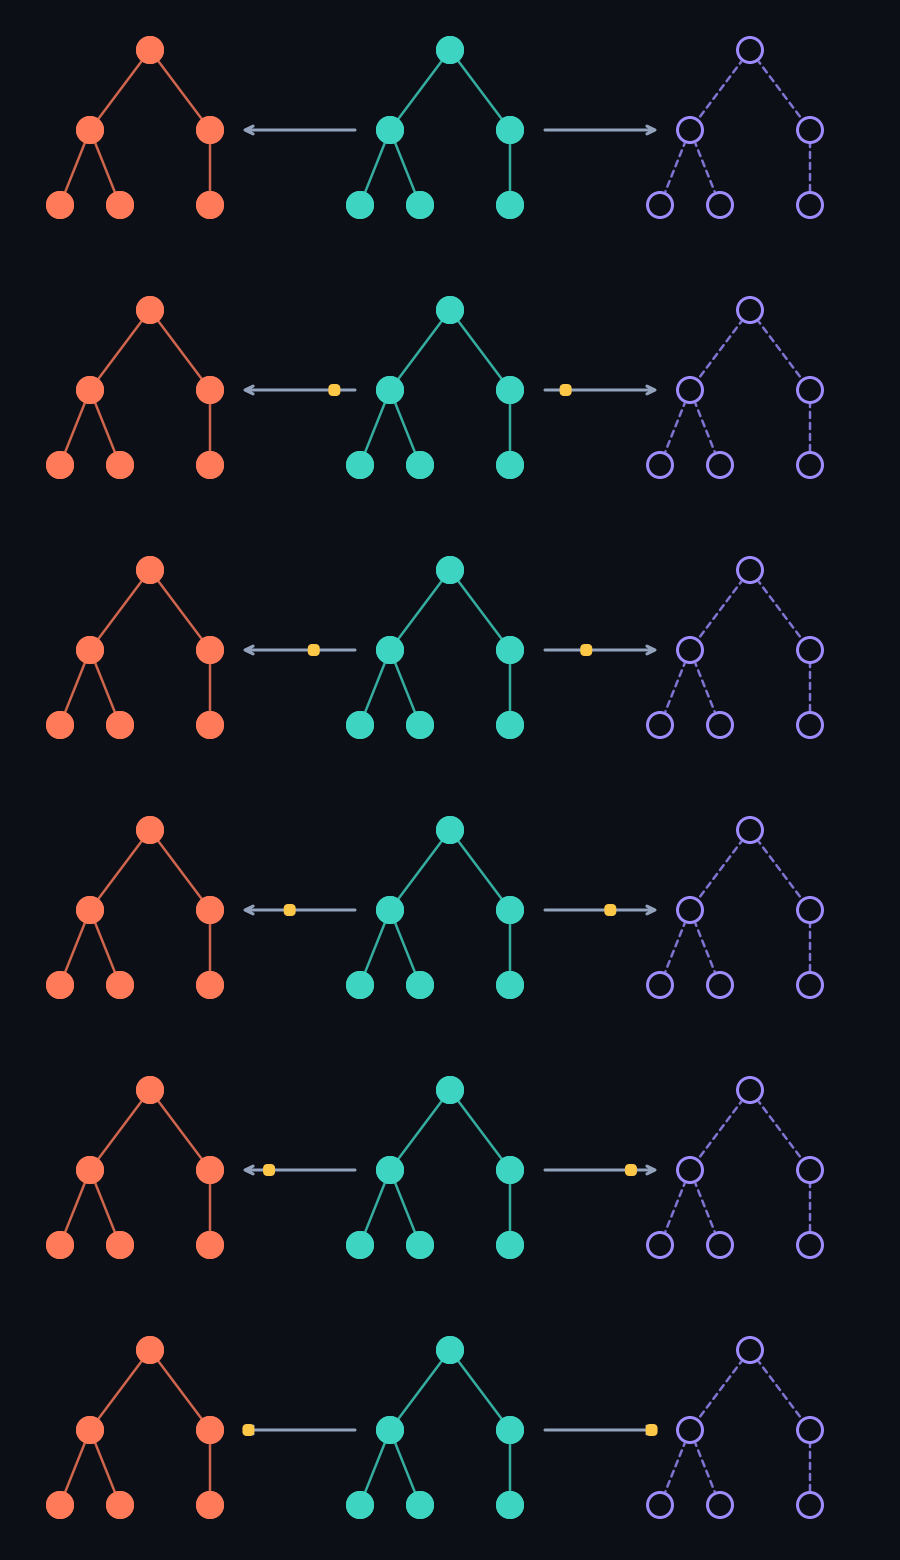
One more sentence, in a box in the same guide, is the whole UIKit story: reading the presentation layer “differs from the layer tree, which always reflects the last value set by your code and is equivalent to the final state of the animation”. From the moment you set it, the layer’s value is the end of the animation. What is on screen is a different value, held elsewhere. Here is that for the opacity animation above. It is drawn from Apple’s definition, linear from 1.0 to 0.2 over 0.5 s. It is not recorded values.
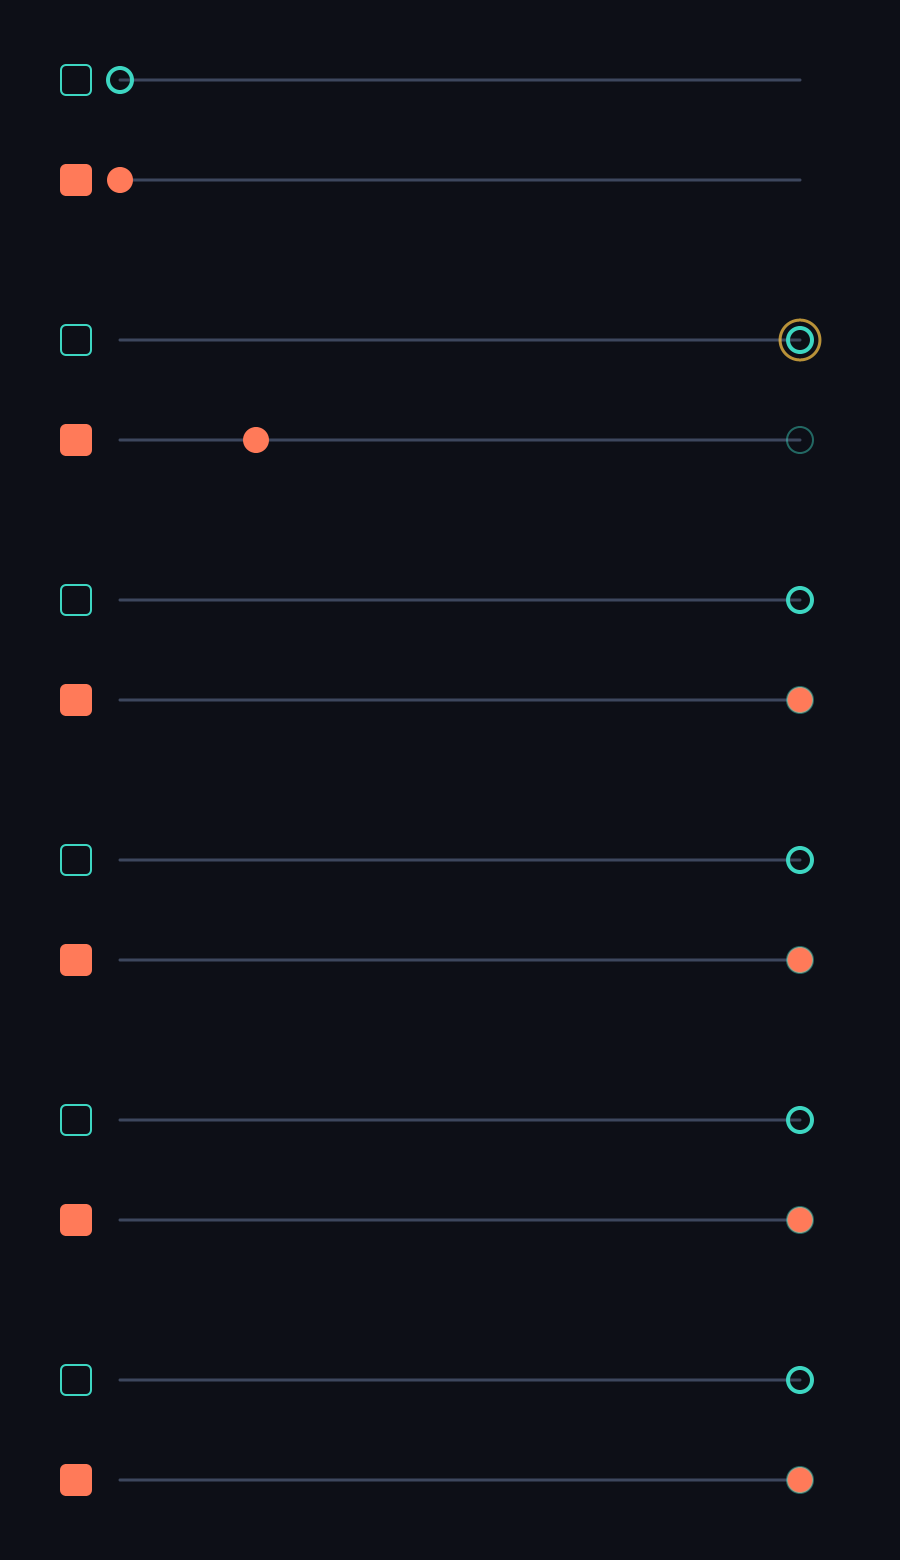
The guide says what a layer is: it “merely manages the state information surrounding a bitmap”, so the main layers you use “are considered to be model objects because they primarily manage data. This notion is important to remember because it affects the behavior of animations”. When a change triggers an animation, Core Animation “passes the layer’s bitmap and state information to the graphics hardware”, which does the work, and you “specify the start and end points of the animation and let Core Animation do the rest”.
flowchart LR
  l["a layer<br/>state and a bitmap"] --> p["bitmap and state<br/>go to the graphics<br/>hardware"] --> f["the hardware draws<br/>every frame"]
Views and layers
In the same guide: “In iOS, every view is backed by a corresponding layer object but in OS X you must decide which views should have layers.” (The guide dates from 2015. It adds that in OS X 10.8 and later “it probably makes sense to add layers to all of your views” and that “most views in OS X are” layer-backed; my understanding that AppKit layer-backs every view automatically for apps built for macOS 10.14 and later I did not check.) On iOS the view’s layer is never nil and cannot be swapped, and the view is the layer’s delegate (UIView documentation). So a UIKit view has a layer for its whole life, and that layer is where an animation lives. On the Mac a layer-backed view has a layer that AppKit creates. A layer-hosting view is the exception: you supply the layer yourself, and AppKit leaves it alone.
flowchart LR
  subgraph IOS["iOS"]
    direction TB
    uv["UIView"] --- ul["its layer<br/>never nil<br/>cannot be swapped"]
  end
  subgraph MAC["macOS"]
    direction TB
    nv["NSView"] --- nl["a layer, if<br/>layer-backed<br/>or layer-hosting"]
  end
What the sessions add
These are Apple’s words from sessions in my library. For session 236 the library is a summary that quotes the speaker only in part, so the wording of those quotes may be the library’s; 213 and 238 are kept as speech. The first is from WWDC 2014, session 236, on setting a property to 500 inside an animation block: “the layer’s model value immediately becomes 500”. Before iOS 8 the default was an absolute animation, which runs from the previous value to the new one in absolute terms.
flowchart LR
  set["you set 500<br/>in a block"] --> m["model value<br/>is 500 now"]
  set --> pr["presentation value<br/>runs toward it"]
That has a cost when you reverse an animation halfway: the value jumps to the endpoint of the first animation, the previous model value, and animates back from there. From iOS 8, additive animations “are the default behaviour for most UIKit-created animations” (session 236). An additive animation is relative to the model value: it runs from the difference between the old and the new model value down to zero. The old animation is not removed. A second is added on top of it, and the drawn value is the sum, so position and velocity both stay smooth. The option BeginFromCurrentState (an option of the UIView animation methods that starts from the drawn value) kept the position but broke the velocity “like it hits a brick wall” (session 236). The additive default is per property, not per block: the library’s lesson notes, from a slide, say that in a block animating center, alpha and tintColor, “only center.x will go additive. alpha and tintColor will not”. Whether opacity, this issue’s running example, jumps when retargeted I did not measure. The same slide says to keep BeginFromCurrentState for such properties, which suggests that without it they can jump, as an absolute animation does, and the probe’s own UIKit code passes no such option.
flowchart TB
  subgraph A["absolute, before iOS 8"]
    direction TB
    a1["reverse halfway"] --> a2["value jumps to<br/>the previous model value"] --> a3["then animates back"]
  end
  subgraph B["additive, from iOS 8"]
    direction TB
    b1["reverse halfway"] --> b2["a second animation<br/>is added"] --> b3["presentation value<br/>is the sum"] --> b4["position and velocity<br/>stay smooth"]
  end
  A ~~~ B
A hit test uses the model value. An animating view is drawn at the presentation value but touched at the model value (session 236). So, my reading, a button that is sliding in is touched where it is going, not where it is. The same session adds that UIView animations swallow touches by default, so this only shows once you turn that default off.
flowchart LR
  drawn["drawn at the<br/>presentation value<br/>halfway along"] --- touched["touched at the<br/>model value<br/>the end"]
An explicit animation is not destructive. AppKit, WWDC 2013, session 213: it is “not actually setting the property on the layer”, it “just temporarily overrides that property for rendering purposes”. A layer whose opacity is 1 and whose animation fades it from 0.75 to 0.25 still reports opacity 1 when you read it.
flowchart LR
  anim["a fade from<br/>0.75 to 0.25"] --> over["overrides opacity<br/>for rendering only"]
  layer["the layer's<br/>own opacity"] --> report["still reports 1"]
Then there is who runs it. In the same session, AppKit’s own animator, for properties it drives itself, “periodically wake[s] up the main thread to do our animation”. Core Animation instead wakes “on a background thread, or maybe another process” and “only evaluates it as a part of rendering”, so, in the session’s words, the values “aren’t going to be back propagated into your layer”. A year earlier, WWDC 2012 session 238, an iOS session, is definite: the render server, the process that draws for Core Animation, is “another process”. The library holds no Mac session that says it as plainly, so for the Mac I rely on session 213’s hedge above. Session 213 also names exceptions to “we try to let core animation drive things”: the frame origin and size of an NSView, where “we don’t necessarily let Core Animation drive them”. The probe’s AppKit offset and width cases look like those properties, yet each ran as one Core Animation animation. The statement says “don’t necessarily”, so I draw nothing from that, and I did not investigate it. Back in session 213, Apple also warns, about a Core Animation animation running at the same time as a window resize animation (which always happens on the main thread), that two animations from the two systems at once “may get out of sync or they may fight”.
flowchart TB
  subgraph AK["AppKit's own animator"]
    direction TB
    k1["wakes the<br/>main thread<br/>periodically"] --> k2["sets the property<br/>each time"]
  end
  subgraph CA["Core Animation"]
    direction TB
    c1["wakes on a background<br/>thread or another<br/>process"] --> c2["evaluates only<br/>as part of rendering"]
  end
  AK ~~~ CA
Put together, Apple documents UIKit and AppKit animation as: describe it, give it to a layer, and something else runs it. (For AppKit that holds with the exceptions named above, where the main thread drives the animation.) That UIKit’s animations are built on Core Animation is the premise of the sessions above.
flowchart LR
  you["you describe it"] --> layer["you give it<br/>to a layer"] --> else["something else<br/>runs it"]
The process, step by step
Here is the process for view.alpha = 0.2 inside UIView.animate. Each numbered step below says how it is known.
flowchart TB
  subgraph APP["Your app, the main thread"]
    direction TB
    a1["you set alpha<br/>inside an<br/>animation block"] --> a2["UIKit adds one<br/>animation<br/>to the layer"] --> a3["the layer's model<br/>value is 0.2<br/>at once"] --> a4["the run loop<br/>commits the<br/>transaction"]
  end
  subgraph RS["The render server, another process"]
    direction TB
    r1["receives the layer<br/>and the animation"] --> r2["each frame, works<br/>out the in-flight<br/>value"] --> r3["draws it"]
  end
  a4 --> r1
Step one, you set a property inside a block, is how UIKit knows the change should animate (documented, the 2014 session). Step two, UIKit adds one animation to the layer. Measured: in all 15 UIKit cases on each of the four iOS and iPadOS platforms, and in all 6 AppKit cases on the Mac, exactly one animation was added through addAnimation:forKey:. The animation keys the probe recorded (read from the layer’s animation keys, on every platform) were opacity, position, bounds.size on UIKit and bounds on the Mac, and transform. On iOS and iPadOS the added animation’s key path equals that key (measured). On the Mac only the key is known: the probe’s hook (a replacement for the layer’s method that records every call) found no key path when AppKit added the animation.
| Property | Animation key of the one animation added (read from the layer, on every platform) | Cases, each with exactly one |
|---|---|---|
| opacity | opacity | 3 kinds on each UIKit platform, 2 on the Mac |
| offset | position | 3 kinds on each UIKit platform, 2 on the Mac |
| width | bounds.size on UIKit, bounds on the Mac | 3 kinds on each UIKit platform, 2 on the Mac |
| scale | transform | 3 kinds on each UIKit platform, none on the Mac |
| rotation | transform | 3 kinds on each UIKit platform, none on the Mac |
Step three, the model value is written once. (The numbering of steps two and three is not a measured order. My reading of how a layer works is the other way round, the value written first and the animation then added by the layer’s action; the probe counted both and did not record their order.) Measured: one different model value in every UIKit case and every AppKit case, and one setter call for each property the case changes (two for an AppKit width change, which sets both bounds and position). Step four, the change is committed at the end of the run loop pass. A Core Animation transaction is a batch of layer changes that a thread sends to the render server in one commit (the run loop commits the main thread’s at the end of each pass); it is not SwiftUI’s update transaction, which is the context of one update of views and is explained in part two. Observed on the Mac, from the stack of a SwiftUI write, which I take to go through the same commit machinery (my reading): the main run loop, then CA::Transaction::flush_as_runloop_observer (named for a run-loop observer, reached in the sample through a run-loop source callout), then CATransaction flush and CA::Transaction::commit. Step five, the render server runs the animation (documented for iOS in session 238, hedged for the Mac in session 213, and described in the guide’s render tree; measured below as consistent with it).
| Step | What happens | How it is known |
|---|---|---|
| 1 | you set the property in a block | documented, session 236 |
| 2 | one animation is added to the layer | measured, in every UIKit and AppKit case |
| 3 | the model value is written once | measured |
| 4 | the change is committed at the end of the pass | observed on a SwiftUI stack; my reading for UIKit |
| 5 | the render server runs the animation | documented; measured below as consistent with it |
The app is no longer in the loop after the commit. My reading is that this is what makes UIKit animation robust: a busy app does not stop it.
flowchart LR
  busy["a busy<br/>main thread"] -.-> rs["the render server<br/>keeps animating<br/>and is not slowed"]
UIKit and AppKit, measured
For one change, opacity 1.0 to 0.2, linear, 0.5 s, the layer received this. One animation, one write. The presentation value, the in-flight one, took 26 (the real iPhone) and 33 (the Mac) different values, read through the presentation layer; the simulators gave 32 and the real iPad Pro 63, and the chart draws the Mac and the real iPhone. That the render server works out the frames it draws (the 26 and 33 values are what the app reads back) is documented for iOS (session 238) and hedged for the Mac (session 213: “or maybe another process”); the next section measures what is consistent with it.
Across every UIKit case, by property and kind, the presentation values the layer showed in the 1.2 s window are below. The spring rows are higher in every property: my reading is that a spring takes more distinct values than a straight run because it overshoots or runs longer; I did not separate the two. The count is the sampler’s, every 4 ms, so it measures how many different values the layer showed, not how many frames the screen drew. Each case is observed for 1.2 s from the trigger (the probe’s observe) and sampled about every 4 ms, so there are at most about 300 readings, and 225 to 260 in the result files; what holds the count below that I did not establish. The counts cover the whole 1.2 s, in which the motion lasts 0.5 s (longer for a spring), so the counts are of the window. Ease in and out is within 4 of linear and is not drawn.
What is consistent with the render server running it
Two tests. First, block the main thread for half a second in the middle of the motion, and read the screen. The dot crosses the screen in 2.4 s; 0.9 s in, the probe lights a blue marker, waits 0.1 s and blocks the main thread for 0.5 s, so the marker is lit for about 0.6 s, and the dot crosses four times (one block in each crossing). Measured, the longest time the UIKit or AppKit dot stayed in one place in a window around the blocks (0.5 s either side of the lit run on the simulator and the Mac, the lit run itself on the devices): 25 ms on the iPhone simulator in one recording (81 ms in a second recording of the same test, with the same verdict), 33 ms on a real iPad Pro and 33 ms on a real iPhone 17 Pro Max, and 120 ms on the Mac, where the capture ran at about 14 frames a second, so one frame is about 70 ms. The USB capture of the devices delivered about 45 to 47 frames a second on average (its commonest gap is 17 ms, which is 60 a second), and its timestamps are uneven. Gaps of 33 ms begin before the marker lights and go on after the dot is at rest, and on the iPad, across a 33 ms gap the dot advances about twice as far as across a 17 ms one (27 px against 13 to 14), so a 33 ms entry on the devices is a missing frame and not a wait of the dot. The feed does resolve single frames (17 ms on the iPhone in three blocks), and on the 120 Hz iPad it sees every second frame at best. The device charts below plot 33 for that reason.
Second, stop SwiftUI’s own render thread (introduced in part two) for half a second while a UIKit animation runs, and read the render server’s own frame counter (through a private C function, from another thread of the probe; the UIKit run also carries a hidden one-point SwiftUI view that pulses forever, so that SwiftUI’s thread exists to be stopped). Measured, frames drawn a second, before and during: stopping SwiftUI’s thread barely changed what the render server drew for UIKit (58.8 against 58.8 on the simulator, 120.5 against 119.0 on the iPad). That is consistent with “the render server runs it” and, with the blocked main thread test above, rules out the main thread and SwiftUI’s thread as what draws UIKit’s frames, on the platforms and in the runs tested (the iPhone simulator and the iPad Pro, one run each).
Part two: SwiftUI
What Apple documents
WWDC 2023, session 10156, “Explore SwiftUI animation”, by Kyle of the SwiftUI team (the library gives no surname), is the main source. The statements below are its, with the lines in the library’s copy. That copy is a summary and not a transcript. Where it quotes the speaker (lines 102, 112, 161, 284, 353, 371, 420) the quotation is the speaker’s words; the lines about springs and merging (454 to 456) and about drawing commands (118) are the summarizer’s prose, which I could not check against the speech. First, why: making animation simple was a core motivation when SwiftUI began, and a big reason it is shaped the way it is (line 35, my paraphrase of the speaker).
flowchart LR
  motive["a core motivation:<br/>make animation<br/>simple"] --> shape["a big reason SwiftUI<br/>is shaped the<br/>way it is"]
Next, an update. “When an event, like a tap, comes in, an update transaction is opened.” (line 102) If a dependency changed, the view is invalidated, and at the close of the transaction the framework calls body (line 106). Behind this is “a long-lived dependency graph that manages the lifetime of views and their data”, each node an attribute that “maps to a fine-grained piece of the UI” (line 112). Line 124 gives the life of an attribute in short sentences.
flowchart LR
  e1["an attribute is born<br/>with a value"] --> e2["an event comes in<br/>a transaction opens"] --> e3["an upstream<br/>dependency changes"] --> e4["the framework<br/>calls body"] --> e5["the value<br/>is updated"] --> e6["the transaction<br/>closes"]
Then the animation. Animatable attributes such as scaleEffect hold a model value and a presentation value. When the value changes and the transaction carries an animation, the attribute copies the animation and interpolates from the old value to the new one as time passes (the copying and interpolating are line 151, my paraphrase of the speaker; the library’s summary says the attributes “conceptually” have both values). Animations work on deltas: Apple’s example, at line 420 of the session, quoted from the speaker, is that an animation of scaleEffect from 1 to 1.5 “isn’t interpolating from 1 to 1.5, but from 0 to 0.5”.
flowchart LR
  old["old value 1"] --> copy["a copy of the<br/>animation"]
  new["new value 1.5"] --> copy
  copy --> interp["interpolates over time<br/>delta 0 to 0.5"]
Next, the sentence this issue tests. “For built-in animatable attributes like scaleEffect, SwiftUI is very efficient. It’s able to do this work off the main thread and without calling into any of your view code.” (line 161) A custom Animatable conformance is the opposite case: it “can be much more expensive to animate than a built-in effect” (line 284), “because it’ll run body for every frame of the animation” (the second half of the speaker’s sentence at line 284).
flowchart TB
  subgraph B["a built-in attribute"]
    direction TB
    b1["off the main thread"] --> b2["without calling<br/>your view code"]
  end
  subgraph C["a custom Animatable"]
    direction TB
    c1["runs body<br/>every frame"] --> c2["more expensive"]
  end
  B ~~~ C
Springs and interruption come next. Apple specifies springs by duration and bounce, because “we’ve never found [mass, stiffness and damping] to be particularly intuitive” (line 353), and “we made a smooth spring the new default when you use a bare withAnimation in iOS 17 and aligned releases” (line 371). Timing curves do not merge and are combined additively. Springs merge: they keep their velocity and retarget (lines 452 to 456 of the library’s summary, the last three of which are its prose, as noted above). I tested the interruption claim on the Mac, in the last comparison of part two.
flowchart LR
  curves["timing curves<br/>combine additively"] --- springs["springs merge<br/>keep velocity<br/>retarget"]
A transaction is a dictionary passed implicitly through the hierarchy, carrying the animation for the current update (line 492, my paraphrase of the speaker). Apple’s withAnimation documentation: it “sets the given Animation as the animation property of the thread’s current Transaction”. So, my reading, withAnimation does not animate anything itself.
flowchart LR
  wa["withAnimation"] --> tx["sets the animation<br/>on the current<br/>Transaction"] --> upd["the update runs<br/>with that animation<br/>in the transaction"]
The reference documentation for the protocol you implement (iOS 17.0+, macOS 14.0+, watchOS 10.0+): CustomAnimation is “a type that defines how an animatable value changes over time”. Its animate(value:time:context:) “calculates the value of the animation at the specified time”. It also has shouldMerge, which “determines whether an instance of the animation can merge with other instance of the same type”, and velocity. State goes in the context parameter. The SDK declares the protocol Hashable and Sendable, with nonisolated methods.
flowchart LR
  in["value<br/>time<br/>context"] --> a["animate"] --> out["the value<br/>at that time<br/>or nil when finished"]
Notice what is not in the session. The library’s summary never names Core Animation or a render server, and says that what leaves the graph is drawing commands. Nothing documented says which thread runs the animation on which platform, apart from the one sentence about built-in attributes. So Apple documents SwiftUI animation as: the framework keeps the animation in the graph, and works out the value for each time.
flowchart LR
  ag["the attribute graph<br/>works out the value<br/>for each time"] --> gap["not documented,<br/>apart from one sentence:<br/>which thread and process"] --> out["drawing commands<br/>leave the graph"]
The code
The probe’s SwiftUI side. The view is one property driven by a switch.
struct Subject: View {
    let toggle: Switch
    let property: Property

    var body: some View {
        let stack = VStack(spacing: 0) {
            Color.red
            Color.blue
        }
        Group {
            switch property {
            case .opacity: stack.frame(width: 60, height: 60).opacity(toggle.on ? 1 : 0.2)
            case .offset: stack.frame(width: 60, height: 60).offset(x: toggle.on ? 90 : 0)
            case .width: stack.frame(width: toggle.on ? 100 : 20, height: 60)
            case .scale: stack.frame(width: 60, height: 60).scaleEffect(toggle.on ? 1.5 : 1)
            case .rotation: stack.frame(width: 60, height: 60).rotationEffect(.degrees(toggle.on ? 90 : 0))
            }
        }
        .frame(width: 200, height: 120, alignment: .leading)
    }
}
flowchart TB v["VStack of two colours<br/>red over blue"] --> m["one modifier driven<br/>by toggle.on"] m --> o["opacity"] m --> f["offset"] m --> w["frame width"] m --> s["scaleEffect"] m --> r["rotationEffect"]
The four kinds of animation (linear, ease in and out, spring, and a custom one that is a callback for a value), written the way Apple’s reference documentation shows.
struct LinearCallback: CustomAnimation {
    let duration: TimeInterval

    func animate<V: VectorArithmetic>(value: V, time: TimeInterval, context: inout AnimationContext<V>) -> V? {
        HookRecorder.shared.recordCustomCall()      // the probe records the thread of each call
        return time < duration ? value.scaled(by: time / duration) : nil
    }
}

extension Animation {
    static func witness(_ kind: Kind) -> Animation {
        switch kind {
        case .linear: .linear(duration: 0.5)
        case .easeInOut: .easeInOut(duration: 0.5)
        case .spring: .spring(duration: 0.5, bounce: 0.3)
        case .custom: Animation(LinearCallback(duration: 0.5))
        }
    }
}
The callback is given a time and returns a value. Here is what that one returns across the half second, drawn from the code above (the fraction of the way to the new value). It is not recorded data. At 0.50 s the code returns nil, which ends the animation, so the chart stops at 0.45.
And the trigger, which is all you write. Compare it with UIKit. There is no alpha = 0.2 on a layer. You change state, and the view’s body describes the state. Where the animation lives is not in your code at all. The custom animation shows the shape of it: SwiftUI hands you a time and expects a value. It asks. UIKit never asks.
withAnimation(.witness(kind)) { toggle.on = true }flowchart TB
subgraph U["UIKit"]
direction TB
u1["you give the end<br/>value once"] --> u2["it never asks<br/>you again"]
end
subgraph S["SwiftUI"]
direction TB
s1["you change state"] --> s2["the framework asks<br/>the animation for a<br/>value at each time"]
end
U ~~~ S
The three platforms, side by side
Same view, same 20 cases, measured on the Mac, a real iPhone 17 Pro Max and a real iPad Pro. First, how many different values the layer’s model took. On the Mac SwiftUI writes the model value on every pass (a pass is one round of SwiftUI’s update for the animation, the unit that calls the custom callback once, twice or four times depending on the property; part one’s “pass” is the run loop’s). On the iPhone and the iPad the sampler sees two values (my reading: the start, which was already there when the first reading came, and the end, and one more for the scale). UIKit shows one, because its setter ran inside the trigger, before the first reading, so its start is never sampled. The two counts differ in when the write happens. For the setter calls below, SwiftUI’s two drawing layers account for the Mac’s 62 calls against 31 values (two layers, 31 values) and for the 2 of offset and width on the iPhone; opacity’s 4 and scale’s 8 on the iPhone are more than one write on each layer. The iPad’s numbers are the same as the iPhone’s, so only the iPhone is drawn. The Mac line is an app writing a layer, and the other two lines are an app whose model took one to three different values in the window (different values, not setter calls) and was left alone while the motion ran: UIKit wrote it once, at the call, and SwiftUI’s model stayed at its start value when inspected 0.3 s into the motion (for opacity linear and offset custom only), so it writes later.
Next, how many times the app called the layer. Scale and rotation are twice the others on the Mac (120 against 60); the Mac record shows 60 calls of setPosition: and 60 of setTransform: for each, and my reading is that each pass calls both, which would give that. The iPad’s calls are the same as the iPhone’s, so only the iPhone is drawn. On the iPhone, scale is 4 calls of setPosition: and 4 of setTransform: and rotation 2 and 2; opacity’s 4 against the 2 of offset and width I did not trace. SwiftUI’s view has two drawing layers, so one write on each gives the 2 of offset and width; opacity’s 4 and the 8 of scale are not explained by that.
Then what the presentation layer showed (the in-app copy of the in-flight value, which can disagree with the screen, as “What I got wrong” shows). The presentation value moved on every platform, which is why you cannot tell the difference by looking. On the Mac, for SwiftUI, I read it as equal to the model value, because the app wrote it and the counts match. On the iPhone and iPad it moved with almost nothing written. The iPad shows between 1.4 and 2.1 times the iPhone’s count. UIKit on the iPhone, drawn in part one, took 26, 42, 27, 27 and 33. Both devices report 120 Hz as their maximum, but the iPhone’s transaction flushes (a flush is one counted call of -[CAPresentationModifierGroup flushWithTransactionAndTargetTime:], the step the diagram in the iPhone process section calls “flushes into its own transaction”; the values themselves go into shared memory) are counted over the 1.2 s window and give no clean rate (28 to 38 for linear, discussed in the iPhone section). The custom animation gives a cleaner one, because its callback stops at 0.5 s: opacity, width, scale and rotation get about 30 passes on the iPhone (the callback is called about once a pass for opacity, scale and rotation and four times for width, and twice for offset, and I count the passes of the custom callback as its calls divided by the calls in one pass), so about 60 a second, and about 60 on the iPad, so about 120. Offset is the exception: its custom case has 78 callback calls on the iPhone (76 off the main thread) against 62 on the simulator (60 off it), and its flush count (38 for linear) is higher too. If offset is two calls a pass, as on the Mac and the simulator, that is about 76 a second, which I did not verify on the device. So the iPhone ran at about 60 for four properties and apparently faster for offset, and I did not resolve why. The UIKit control on the same iPhone has a raised offset too (42 different presentation values against 26 to 27 for opacity, width and scale), with no callbacks or flushes, so my reading is that it is not specific to SwiftUI (the quantities differ: callbacks and flushes for SwiftUI, different values seen by the sampler for UIKit); its rotation is raised as well (33 to 51 across the three kinds, against 26 to 27 for linear opacity, width and scale and 44 to 46 for the spring’s opacity, width and scale (its offset is 50)), which SwiftUI’s is not. The iPhone’s render server frame counter reads about 60 whatever the app does, even idle, so that counter cannot confirm the 60 a second. A likely reason, documented: the Info.plist key CADisableMinimumFrameDurationOnPhone “allows your app to access frame rates higher than the system’s default” on ProMotion iPhones, and I found no such key in the probe’s sources, so the probe was probably held to the default for most cases. I did not test with the key, so I have not confirmed it as the cause. It does not explain the offset case, which had more callbacks and flushes than that default would allow, and it does not explain the render server’s own counter reading 60 when the app is idle.
The custom kind lets the probe see something the built-in kinds do not: the thread of every call to animate. Measured, and the part that matters: on the Mac every one of those calls is on the main thread. On the iPhone all but one to four of each case are off the main thread (30 of 31, 76 of 78, 124 of 128, 30 of 31, 30 of 31), and on the iPad likewise (60 of 61, 120 of 122, 240 of 244, 60 of 61, 60 of 61). The ones on the main thread come from a main-thread render pass (the recorded stack runs through GraphHost.runTransaction and ViewGraphRootValueUpdater.render), once for opacity, scale and rotation, twice for offset and four times for width, the same as the calls in each pass; the stack is cut short, so I do not know what started that pass.
The counts differ by property, on the Mac from about one call a pass for opacity, scale and rotation to two for offset and four for width (the passes are about 31 on the Mac, and I did not trace why the calls per pass differ), and the iPad’s are about double the iPhone’s, except for offset, where the ratio is 1.6. The custom animation here animates the same built-in attributes, so my reading is that Apple’s sentence about those applies to where it runs; the verdict on that sentence is in “Apple says, I measured” below.
One summary chart of the whole probe: how each of the 20 SwiftUI cases was classified on each platform. A case where the app writes the layer on many passes and adds no animation is appWrites. A case where nothing public is added, the model takes two or three different values and the presentation moves anyway, with presentation modifiers seen (private Core Animation objects, explained below), is presentationModifier. “Many” values means more than 10 different values (the probe’s manyValues).
SwiftUI on the Mac
The process
The Mac has no thread of SwiftUI’s own here. Observed, from the stack of a layer setter call, from the outermost frame in: the main run loop, then CA::Transaction::flush_as_runloop_observer, then CATransaction flush and CA::Transaction::commit. Then NSDisplayCycleFlush, which is AppKit’s. Then SwiftUI’s ViewGraphRootValueUpdater.render(interval:updateDisplayList:targetTimestamp:), then ViewGraph.renderDisplayList(asynchronously:time:nextTime:targetTimestamp:...) with withMainThreadRender. Then DisplayList.ViewUpdater.render and, for a geometry change, updateGeometry and CoreViewSetGeometry, which call the layer setter directly (no AppKit frame setter showed in the stack); an opacity write goes from updateState to setOpacity: without the geometry frames.
flowchart TB
  subgraph MAIN["Your app, the main thread, once per pass"]
    direction TB
    m1["AppKit's display<br/>cycle runs"] --> m2["SwiftUI is given<br/>a time"] --> m3["it works out the<br/>value at that time"] --> m4["it writes the layer,<br/>no animation object"] --> m5["the transaction<br/>commits"]
  end
  subgraph RS["The render server"]
    direction TB
    r1["receives the layer<br/>values"] --> r2["draws what<br/>it was given"]
  end
  m5 --> r1
The name AsyncRenderer, the name of SwiftUI’s own thread on the iPhone (below), does not appear anywhere in the Mac’s output. SwiftUI has an asynchronous render path, a flag asynchronously:. On iPhone and iPad it takes it. On the Mac, in these runs, it does not.
flowchart LR
  flag["asynchronously:<br/>the flag"] --> ios["iPhone and iPad:<br/>taken"]
  flag --> mac["Mac:<br/>not taken in these runs"]
What it writes, by kind of animation
The calls are flat across linear, ease and custom for each property (within 4 of each other, and only linear and spring are drawn), and higher for the spring on four of five: the same app writes the layer on every pass, whatever the curve. No animation was added in any of these 20 cases. Measured.
In every SwiftUI case on the Mac the counts of different model values and of different presentation values are equal, which I read as the two being equal. No animation was added to the layer, so my reading is that nothing else moves the presentation value. Linear and spring are drawn; ease in and out and custom are within 1 of linear.
With the main thread blocked
On the Mac, blocking the main thread stopped the animation in the blocks I could judge. Measured, window-server capture, the longest time the dot stayed in one place near a block (the capture ran at about 14 frames a second, so a wait can be longer than the half-second block): 586 ms for SwiftUI against 120 ms for AppKit, and the SwiftUI dot was in a new place in none of the frames of the blocks I could judge. That is what I measured on one build of the Mac, in 2 usable blocks, and nothing here says it holds on any other platform. Only 2 of the 4 SwiftUI blocks had enough frames, because the capture in the other two was irregular (gaps of about 125 ms); the capture ran at about 14 frames a second. The custom animation’s callback count inside the block (counted from 0.05 s after the block starts to 0.05 s before it ends, about 0.2 s; the iPhone section explains it): 0. Here are the two recordings (AppKit on the top row, SwiftUI below), redrawn from the measured dot positions and replayed together at half speed, with the red bar growing under the row while its dot stays where it is.

SwiftUI on the iPhone
The process
Here the thread is SwiftUI’s own, and the layer is not written on every pass. This is the part that took a debugger.
flowchart TB
  tick["SwiftUI's own display<br/>link ticks<br/>(seen on the simulator)"] --> evaluate
  subgraph T["SwiftUI's thread: com.apple.SwiftUI.AsyncRenderer"]
    direction TB
    evaluate["evaluates the<br/>animation at this<br/>time"] --> queue["queues the value<br/>in an async layer"] --> commit["commitAsyncValues<br/>takes the queued<br/>values"] --> write["writes each value<br/>into a modifier's<br/>shared memory"] --> send["flushes into its own<br/>transaction and<br/>commits it"]
  end
  subgraph R["The render server"]
    direction TB
    swap["swaps the buffer<br/>and reads the value<br/>(my reading of the code)"] --> draw["draws the layer"]
  end
  memory["the shared memory,<br/>114,688 bytes"]
  write --> memory
  send --> swap
  memory --> swap
Step one: SwiftUI evaluates its animation on a thread named com.apple.SwiftUI.AsyncRenderer, and on the simulator that thread runs its own display link (a timer that fires once for each frame of the screen). The thread name is observed on two real devices and the iPhone simulator, from call stacks and a sampler; on the iPad simulator only the measured counts, not a stack. On the simulator, each tick calls ViewGraphHost.displayLinkTimer(timestamp:targetTimestamp:isAsyncThread:) (on the devices only the thread name and renderAsync were seen), then renderAsync, which updates the graph and renders the display list (SwiftUI’s internal list of what to draw for each view) asynchronously.
flowchart LR
  link["display link"] --> timer["displayLinkTimer"] --> ra["renderAsync"] --> g["updateOutputsAsync<br/>the graph"] --> dl["renderDisplayList<br/>asynchronously"]
Step two: the value is queued, not applied. Read from code: DisplayList.ViewUpdater.AsyncLayer.setValue (there are 86 symbols for AsyncLayer, about 25 of them setValue, read from code; my reading is that those setValue symbols cover about 22 different properties, which would be far more than the probe’s five) boxes the value (in the opacity version I disassembled, in an NSNumber) and appends it to a dictionary keyed by the layer’s identity. It does not touch a layer.
flowchart LR
  val["the value"] --> box["boxed in<br/>an NSNumber"] --> dict["appended to a dictionary<br/>keyed by the layer"]
Step three: commitAsyncValues(targetTimestamp:) takes the queued values. Read from code, then observed with lldb on the simulator: its code contains two groups of Core Animation calls, one that builds CABasicAnimation objects and one that builds CAPresentationModifier objects. In a 14 second loop, addAnimation:forKey: was called 0 times, addPresentationModifier: 44 times and setValue: on a modifier 302 times, all on the AsyncRenderer thread. The CABasicAnimation branch exists and was never taken in that loop.
The chart shows the SwiftUI loop only. No breakpoint was set on addAnimation:forKey: in the UIKit loop (UIKit does add one per case, measured above), and the other two had zero hits there.
Step four: a presentation modifier holds the value in shared memory. CAPresentationModifier is a private Core Animation class, not declared in the public QuartzCore headers. A layer given one for a key path shows that value in its presentation, without a change to the model value and without an animation. That is what the numbers above show. That this is the class’s purpose is my reading, from its behaviour and the setUpdatesAsynchronously: call on its group (a group is the object that holds a set of presentation modifiers’ values); I did not read QuartzCore’s implementation of it.
flowchart LR
  layer["a layer with a<br/>presentation modifier<br/>for the key path opacity"] --> shows["shows the modifier's<br/>value in its presentation"]
  layer --> model["its model value<br/>is not changed"]
Step five: the thread commits its own transaction. Observed on the simulator, in a debugger run: of 1,008 commit() calls in a SwiftUI loop, 913 were on that thread and 95 on the main thread; in a UIKit loop, all 77 were on the main thread.
What the layer got, by kind of animation
Scale and rotation cost about twice the others: each moves two key paths (position and transform), where opacity, offset and width move one each (opacity, position, bounds). SwiftUI added two modifiers for the simple properties and three or four for the transform ones (for linear; the spring’s opacity case added three or four). The spring is the outlier in both directions: fewest for opacity (42), most for scale (171). The chart draws linear and spring; ease in and out and custom are within 9 of linear.
Flushes with a transaction, defined earlier, number about 23 to 44 in one case (nominally half a second of motion). The linear cases have 28 to 38 in the window. That is 56 to 76 a second only if every flush falls inside the 0.5 s of motion. The 28 to 30 of four properties fit a steady 60; the 38 of offset does not, and I did not establish whether flushes also come outside the motion, so I take the rates from the custom callback and not from these. The spring’s higher count in some cells fits it running longer than half a second (each case is observed for 1.2 s and the counts cover all of it), which I did not measure; it does not fit every cell, since the spring’s opacity count (23) is below linear’s. Scale and rotation write about twice as many values in the same number of flushes, because a frame writes several key paths. Linear and spring are drawn; the other two kinds are within 5 of linear.
Modifiers added per case, by property, the number of private objects SwiftUI makes for a motion (measured, linear): two for opacity, offset and width, three for scale and four for rotation on the iPhone, and four for both transform properties on the iPad. These counts are for the linear case. The other kinds on the iPhone added four for scale too, so the 3 against 4 is variation between cases, not a difference between devices.
The bytes
The values are in shared memory. I could reach a group’s memory from inside the app and read it every 4 ms. It is 114,688 bytes, and the first 112 bytes of one reading from the iPhone 17 Pro Max look like this, coloured by field. The sequence numbers, the times and the opacity series quoted below come from the iPhone simulator, not from that reading.
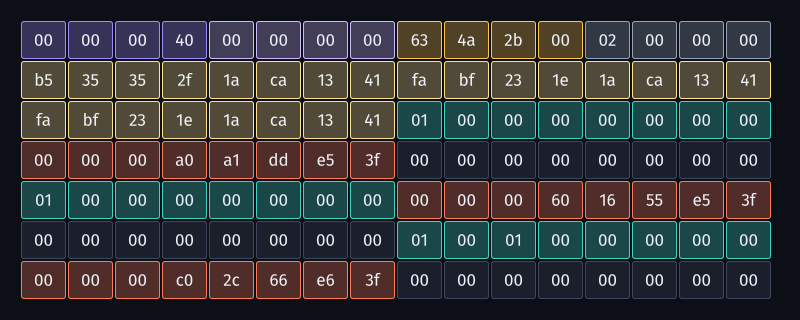
The layout, measured, field by field. In each set of three records (the three records of one modifier, as I read it), the third has flags 0x10001 and the other two have 0x1.
| Bytes | Content | What was seen |
|---|---|---|
| 0 to 3 | u32 flags, 0x40000000 or 0x40000001 | bit 0 alternates between readings, as the flip in flush_presentation_modifier_shmem (read from code, below) does; the alternation alone does not show which side flips it |
| 4 to 7 | u32 flip flag | 0 or 1, equal to bit 0 of the word before |
| 8 to 11 | u32 sequence number | non-decreasing in every run (113,458 to 113,481 on the simulator over one cycle) |
| 12 to 15 | u32 count | 2 |
| 16 to 39 | three doubles | times, about 636,640 s in the simulator reading (the same clock as the messages captured there; the device reading shows about 324,229 s) |
| 40 on | records of 24 bytes: a u64 flags word, a double value, a double that is 0 | six records, two groups of three (the picture above shows the header and the first three) |
The double of each record is the opacity. It rose from 0.4000 to 0.7667 in one cycle and fell from 0.8167 to 0.4167 in the next, in steps of 0.0333, one every other 16.7 ms frame (the third record steps 0.0167 each frame): a slope of 1.0 a second, which is the 0.2 to 1 ramp over 0.8 s of that run (a separate run from the 0.5 s cases above). The two modifiers hold identical series. That the three records of a modifier are a current value and two earlier ones, a triple buffer, is my reading of the flags and the rates, not read from code, and I have not reconciled it with the swap of two buffers that the flush function does (read from code, below).
Per case, the number of values written into shared memory. These are the same writes as the modifier values above, plus a few more, which I guessed were the group’s own bookkeeping; the surplus for linear on the iPhone (2, 2, 2, 3, 4) equals the modifiers added per case, so that guess is not established, and on the iPad the same subtraction matches the modifier counts for only two of the five properties. Linear and spring are drawn; the other two kinds are within 10 of linear.
And the messages. A message here is one Mach message, the system’s way of sending data to another process, sent by SwiftUI’s thread, most of them to the render server (the 32 others, with other ids, I did not identify) (caught with a breakpoint on the send call; the header names the receiving port, and a context is, as I understand it, one tree of layers that the server draws; I read the pairs of messages below as one for each of two contexts, which is not established). Observed on the simulator in a separate 25 second loop from the commit counts above and below, so the counts do not add up to each other, 1,151 messages from the thread: 554 of 72 bytes, 543 of 84 bytes, 22 large ones of 1,720 bytes (these carry the memory object’s port) and 32 others.
The 72 and 84 byte messages are both a Core Animation transaction record, and neither carries a value. Here is a real one of each, coloured by field. The 72-byte message is a transaction with no commands.
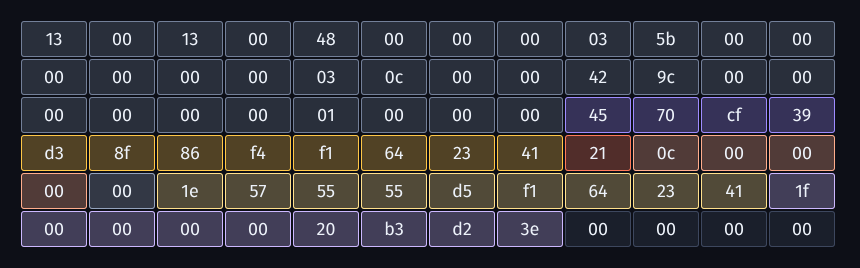
The 84-byte message is the same record with a reference to the shared memory in front of it: marker 0x24 and a 9-byte key. My reading is that the large message defines the memory object and the small ones refer to it by key.
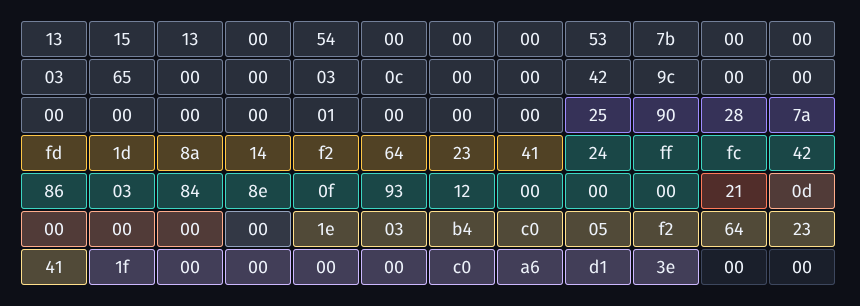
I found which function writes each marker by scanning QuartzCore’s code for the store instruction: 0x21, 0x1e and 0x1f in CA::Context::commit_transaction, and 0x24 in CA::Context::commit_command. That the key is a cache key is my reading, from the match with Shmem::caches_encoding().
| Bytes | 72-byte message | 84-byte message |
|---|---|---|
| 0 to 23 | Mach header, id 0x9c42 | same |
| 24 to 31 | u32 0, u32 1 | same |
| 32 to 35 | context id | a different context id |
| 36 to 43 | double: a time (A) | same |
| 44 to 53 | nothing | marker 0x24 and the 9-byte key |
| 54 to 57 | nothing | one varying byte and three zero bytes |
| then | marker 0x21 and a 4-byte counter that rises by 1 almost every step | same |
| then | a flags byte, 0 in every message | same |
| then | marker 0x1e and a double: a time (B), a median 10.6 ms before A | same |
| then | marker 0x1f and a double (C), 1.71 microseconds to 6.49 ms, median 3.5 microseconds | same |
| last | a final zero word (four zero bytes, bytes 68 to 71, which reconcile the fields to 72 bytes) | two zero bytes of padding |
Where double C comes from I did not trace, and I call the counter after 0x21 a per-context commit counter only because of how it behaves. In a second capture, every one of 487 84-byte messages had a 72-byte message within 4 ms of it, which I read as a pair for each commit, one to each of two contexts. I did not reconcile that with the commit counts above, which come from other loops.
With the main thread blocked
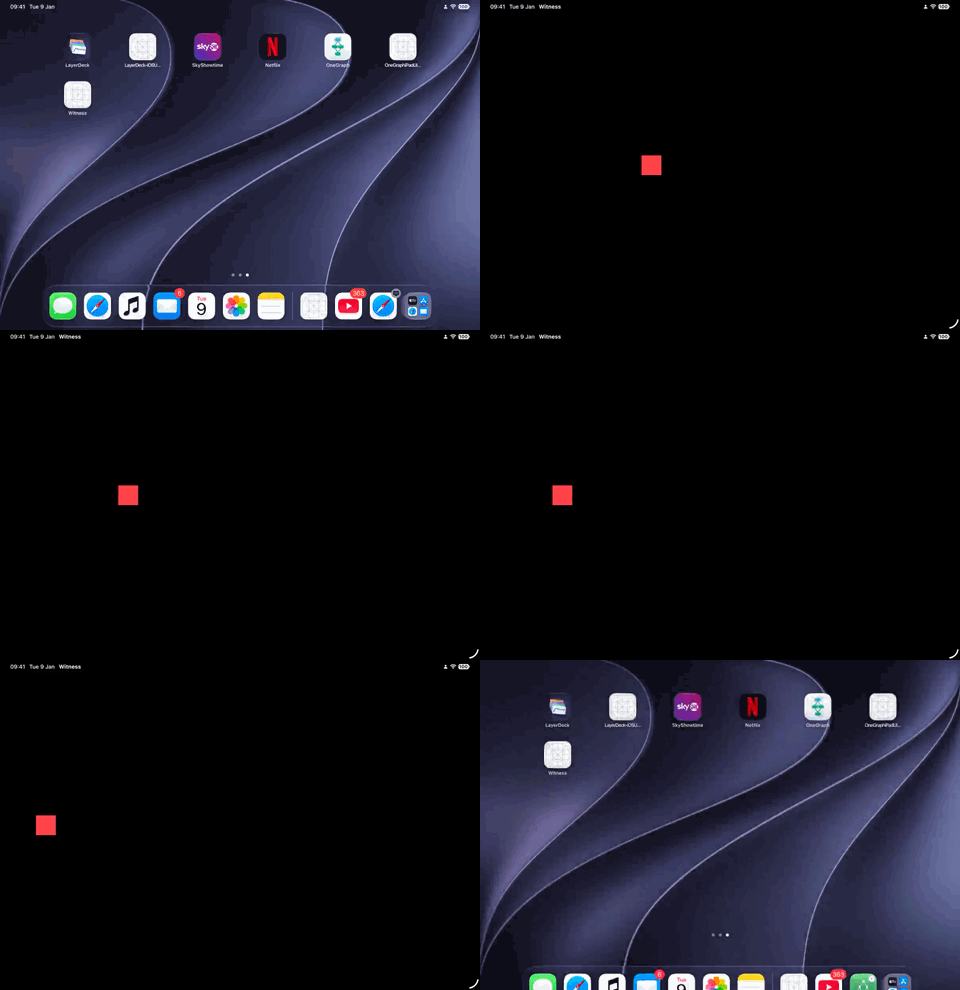
Measured: with the main thread blocked for half a second, the custom animation’s callbacks inside the block (this test moves offset, and the block starts 0.25 s into the animation; callbacks are counted from 0.05 s after the block starts to 0.05 s before it ends, so about 0.2 s of motion, since the callback stops at 0.5 s; the stretch is worked out from the code, not measured): 32 on the real iPhone, none of them on the main thread. In a separate test, the SwiftUI dot kept moving at 262 pixels a second, as the UIKit dot did, and never waited more than 33 ms (two capture frames, which can be a gap in the feed). The recording of the real iPhone, SwiftUI, main thread blocked:

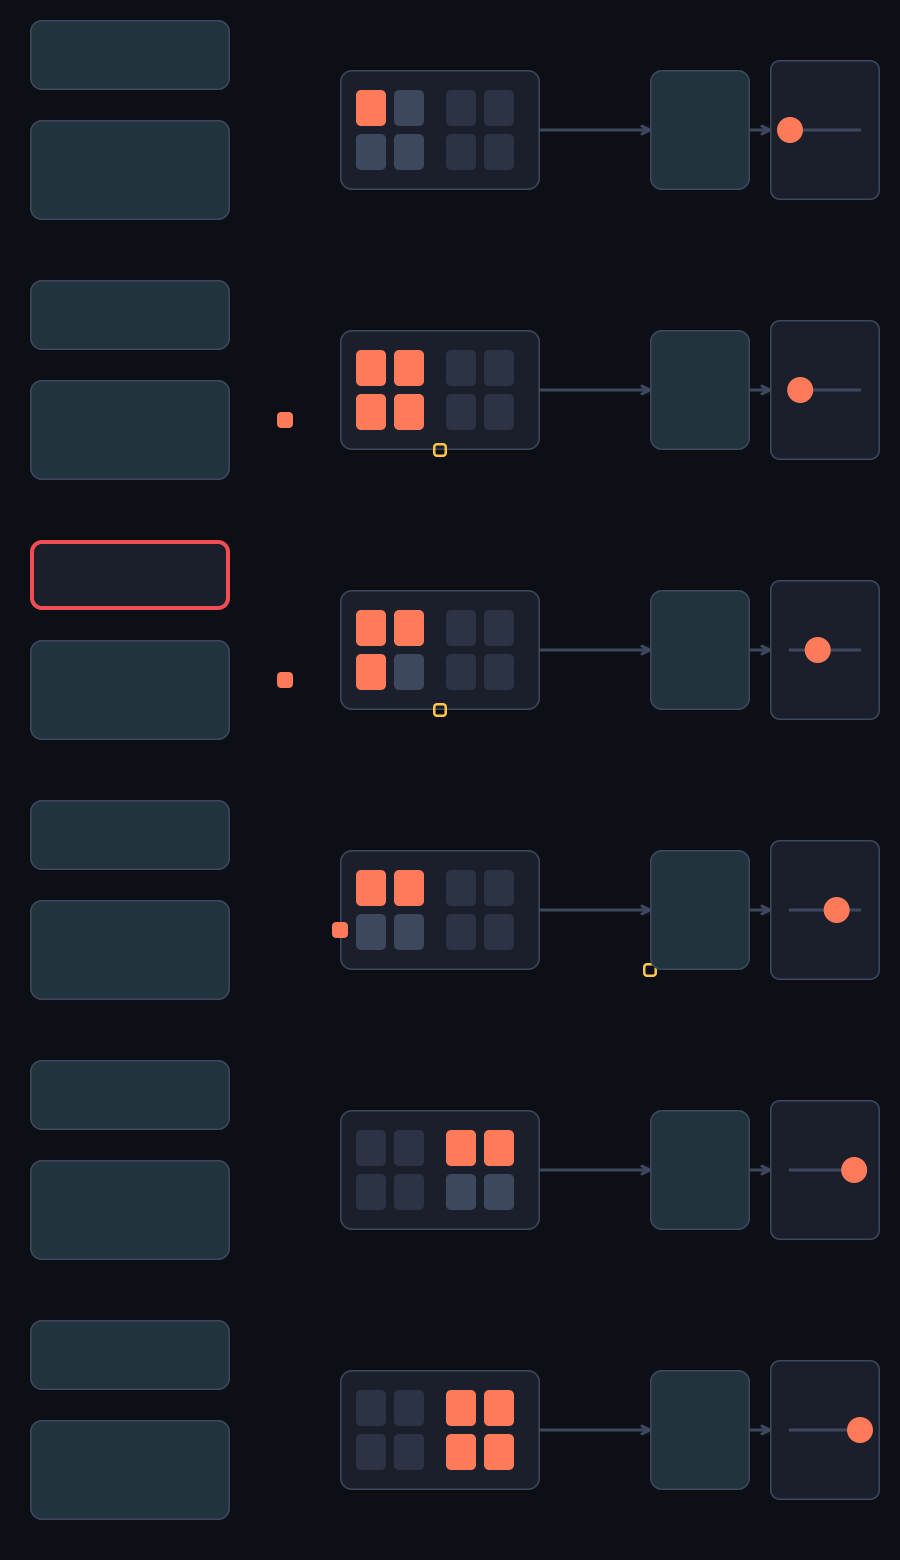
The two recordings (one run for each animation), redrawn from the measured dot positions and shown together at half speed, UIKit on the top row and SwiftUI on the bottom row. No red bar grows under either.

With SwiftUI’s own thread stopped instead, the SwiftUI dot froze for 467 to 500 ms and the UIKit dot did not.

SwiftUI on the iPad
The iPad Pro is the same machine as the iPhone, at about twice the work (for linear, 1.5 to 2.0 times the values written and 1.6 to 2.1 times the flushes, least for offset): same thread and same classes (observed). The difference is the number. Scale on a spring sets the most values on presentation modifiers of any case in the probe: 341 in one case (nominally half a second). The chart draws linear and spring; the other two kinds are within 4 of linear.
Transaction flushes are flat at 56 to 60 for every property and kind except the spring, which runs from 46 to 85. At 120 frames a second, half a second is 60 frames; the flushes, counted over the 1.2 s window, are near that. Linear and spring are drawn; the other two kinds are within 3 of linear.
Values written into shared memory per case on the iPad, by kind of animation. Linear, ease and custom agree within 5 for each property (only linear and spring are drawn), and the spring is the outlier in both directions, as on the iPhone.
iPhone against iPad
The iPad flushes about twice as often as the iPhone for the same case (for linear, 1.9 for opacity, 1.6 for offset and 1.9 for width), in line with the iPad running at about 120 a second against the iPhone’s 60, and with offset the exception on the iPhone. Its writes are about double for linear in four of the five properties (117 against 59, 114 against 62, 231 against 119, 232 against 118) and less regular for the spring (about double for opacity, scale and rotation, but 142 against 93 for offset and 135 against 86 for width). The offset ratio of 1.53 is close to its linear ratio of 1.51, so that one may be the iPhone’s high offset count again rather than a spring effect. The width ratio of 1.57 against 1.84 for linear I cannot explain. The iPhone’s ease case for width also has more flushes than its linear one (35 against 30), so it may be variation between cases and not a spring effect, and the iPhone’s flush counts do not give a clean rate, so a spring’s length need not cancel exactly. I did not measure how long each spring ran.
The chart gives the ratios, iPad over iPhone, for the linear case: the values written and the flushes. Both sit near 2, the ratio of the rates the two ran at (about 120 a second on the iPad against about 60 on the iPhone), except for offset, where the iPhone wrote more than its neighbours (77) and the ratio falls to 1.5 for values written and 1.6 for flushes.
With the main thread blocked, the iPad’s custom animation made 52 callbacks inside the block (counted over the same shortened stretch), none on the main thread, and in the separate crossing test the SwiftUI dot kept its speed, 817 pixels a second against 815 to 816 for UIKit. With SwiftUI’s own thread stopped, the SwiftUI dot froze for 450 to 483 ms. The recordings of the real iPad:
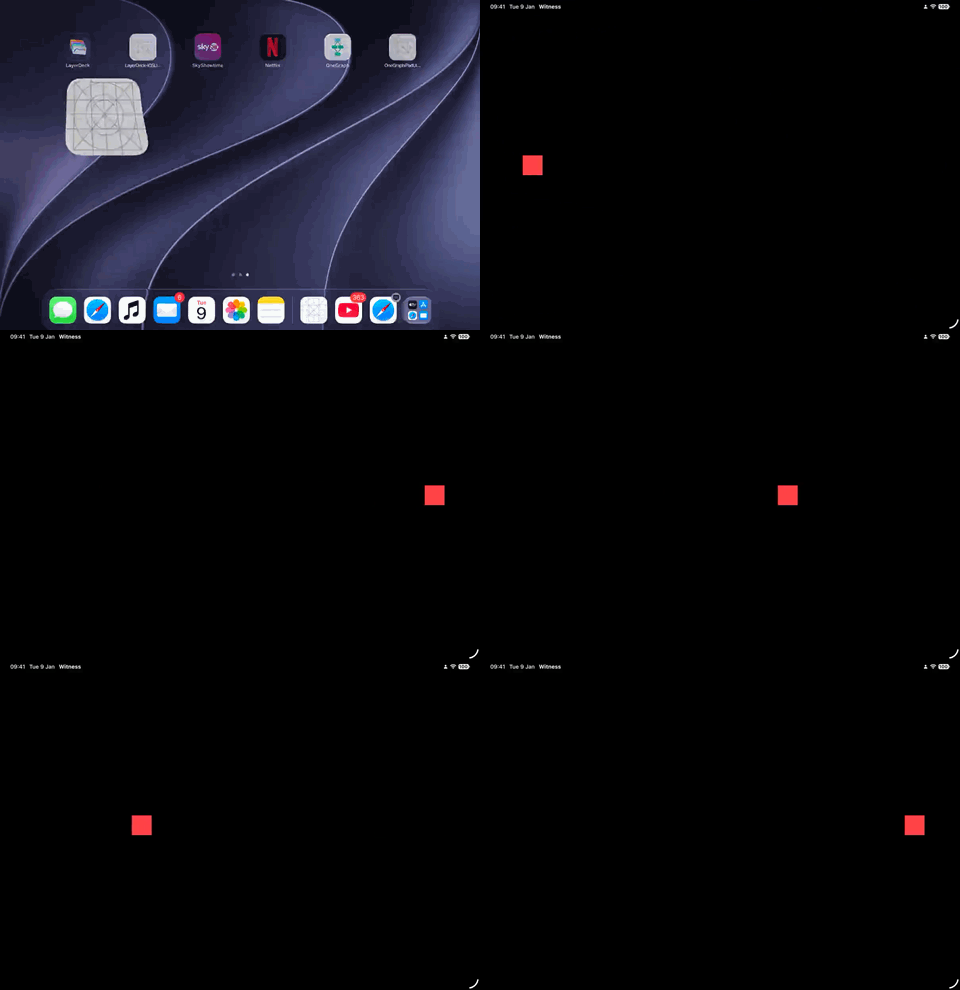
The control, replayed from the measured positions: the same instrument and the same dot, but with SwiftUI’s own thread stopped instead of the main thread. Now the red bar grows under the SwiftUI row, and the UIKit row does not notice.

The real devices against their simulators
The simulators run the iOS frameworks at 60 Hz (the header of their result files), with a render server of their own, the simulator’s backboardd. They agreed with the devices on every verdict (all 20 cases presentationModifier), and on the numbers that follow the refresh rate they track the iPhone and not the iPad: the iPhone simulator’s linear opacity case wrote 56 values and flushed 28 times, against the real iPhone’s 59 and 30. The exception is offset: the simulator wrote 57 values and the real iPhone 77. That is measured. It is why I trust the simulator for the shape of the mechanism, where the debugger works, and the devices for the numbers.
What the render server does
The server’s own frame counter shows it from the other side. Stop SwiftUI’s thread for half a second and the frames the server draws fall, on the iPhone simulator from 59.9 a second to 0 and on the iPad Pro from 120.4 to 5.4. With a UIKit animation and the same thread stopped they barely moved, as the chart in part one shows. So, my reading from one run each, on the iPhone simulator and the iPad the server does not run a SwiftUI animation on its own: the counter is consistent with it drawing when SwiftUI’s thread has sent it values, which a frame counter alone does not show. The real iPhone is left out, because its counter reads about 60 whatever the app does, as noted earlier.
flowchart LR
  uk["UIKit animation,<br/>SwiftUI thread stopped"] --> same["the server keeps<br/>drawing"]
  sw["SwiftUI animation,<br/>SwiftUI thread stopped"] --> none["the server draws<br/>almost nothing"]
A debugger is refused on the render server, even in the simulator. So I read its code and watched it from outside. Read from code: CA::Render::Context::flush_presentation_modifier_shmem is 19 instructions, counting the return. By the probe’s notes it has two callers, one in the app’s own commit path and one in the server’s command stream, so the bit the app reads does not by itself show that the server flipped it. It returns for a null or tiny memory object; otherwise it flips a flag at offset 4 and atomically rewrites the first header word with bit 0 set to that flag. My reading of those instructions is a swap of two buffers.
flowchart LR
  w["one side writes<br/>the values"] --> flip["the flush flips<br/>a flag at offset 4"] --> cur["the other buffer<br/>is now current"]
On the render server’s side, PresentationModifier::fetch reads a record’s value (a slot, in the code’s word) out of the shared memory and PresentationModifier::apply sets the layer’s value. That the server does this on every frame I did not observe: I read it, I did not run it.
flowchart LR
  layer["the render layer"] --> fetch["PresentationModifier::fetch<br/>reads a slot"] --> apply["PresentationModifier::apply<br/>sets the layer's value"]
Seen from outside, with Instruments: attaching xctrace to the simulator’s backboardd records its threads. Over 10.6 seconds, SwiftUI loop against UIKit loop, the render server’s message thread did more work and its frame-drawing thread did not. The extra work was about 2.3 message calls and about 1.7 port releases for each of the app’s roughly 51 commit_transaction calls a second, from 115 and 88 extra calls a second divided by about 51. The 51 was counted in a different run; the 25 second loop below gives about 80 a second, and I did not establish why the rate differs. I take (my reading) the extra work to be the cost of the per-frame transactions. Neither this difference nor the 29 a second fewer calls on the drawing thread below is bounded by a repeated run, so I draw nothing firm from either. The chart also has two categories the text does not explain, thread property (176) and madvise (74), which I did not trace.
The thread that draws frames did about the same work in both runs (a 4% difference in total calls, one run each). Its calls changed by about 29 fewer message calls a second, 3 fewer port releases and about 12 fewer madvise calls, which I take to be run-to-run variation around the same work; I did not repeat the run to bound it.
Counted with breakpoints on the simulator, 25 seconds of each loop. The commit counts above and the call counts here come from two breakpoint runs, so they do not add up to each other (add_command was 882 in the commit run (879 and 3, by thread) and 860 here). The modifier write here is the write call, not the setValue: counted earlier in a 14 second loop. add_command adds a command to a transaction. In a logged run every call from SwiftUI’s thread was command code 27 with no payload, so the command carries no values. Two of the three charted counts are zero for UIKit: it creates no groups and writes no modifiers. Flushes with a transaction were also 922 against 0, the same count as the modifier writes (the per-case hooks count about two writes for each flush, 59 against 30, and this breakpoint run 922 against 922; the same run counted flushLocallyWithTargetTime: 461 times, half as many; I did not reconcile the two instruments), and commit_transaction was called 1,996 times against 453 (counted in the commit run; it runs more than once for each commit()); both are left off the chart. The UIKit loop still commits, on the main thread as counted above, which I take (my reading) to be because the app’s own root view is SwiftUI and the loop updates it, or simply because every UIKit animation is committed from the main thread (step four); I did not separate the two.
Apple says, I measured
Seven claims are listed; five are compared, one is untested and one is inconclusive. The table holds the first three, the documented UIKit side, with the evidence for each; the fourth to the seventh follow in order.
| Apple says | Mac | iPhone and iPad |
|---|---|---|
| the animation lives on the layer (UIKit and AppKit) | one added per case | one added per case (15 of 15 cases on each iOS platform) |
| the property is not set destructively | the model was written once, at the call; the animation is a separate object | the same |
| another process runs it | blocking the main thread did not stop the AppKit dot | blocking the main thread did not stop the UIKit dot; the render server’s frame counter held |
Two limits on that table. The second row shows the model written once at the call; I did not test that adding an animation alone leaves the property unchanged. In the third row the Mac cell shows only “not the main thread”. On the iPhone simulator and the iPad Pro there is more: for a UIKit animation the render server’s frame counter stayed within 1.5 frames a second when SwiftUI’s thread stopped, one run each, so the main thread and SwiftUI’s thread are ruled out as what draws UIKit’s frames there. That is consistent with another process running the animation, and it does not show it.
The fourth is about SwiftUI: it works out the value as time passes, from a copy of the animation (line 151, my paraphrase of the speaker). Measured: on every platform, no animation is added to a layer through the public call. That is 0 addAnimation:forKey: calls in 80 SwiftUI cases on iOS and iPadOS (20 on each of four platforms) and 0 in 20 on the Mac. That shows only that no public animation object was added. It is consistent with the claim and does not test where the value is computed; the counts of the custom callback’s calls, earlier, bear on that more directly.
The fifth is the sentence this issue tests. Built-in attributes run off the main thread and without calling your view code (line 161). Observed (stacks, breakpoints and a sampler) and counted for the custom animation: the off-the-main-thread half is true on the iPhone and iPad (the model taking two or three different values, written on the main thread, and the presentation modifier writes from SwiftUI’s thread; I did not measure whether view code was called), not true on the Mac in these runs (every write on the main thread, on macOS 27.0.1, and the probe’s verdict was the same in a Release build on 27.2.1). Apple’s sentence says SwiftUI is “able to” do this, a capability, so the Mac result shows it was not taken here, not that it cannot be. The second half I did not test, and nothing in the session says it is about iOS alone.
The sixth is the custom animation. A custom Animatable runs body for every frame (line 284). Not tested: I tested the newer CustomAnimation callback, which is a different thing (its threads and call counts are in the section “The three platforms, side by side”). Whether body runs for every frame I did not measure.
flowchart LR
  a["Animatable<br/>runs body each frame"] --> t["not tested"]
  c["CustomAnimation.animate<br/>called each frame"] --> o["counted:<br/>main thread on the Mac<br/>off it on iOS"]
The seventh is interruption. Springs merge and keep velocity, curves are additive (the library’s summary of session 10156). Observed in one run, on the Mac only: reverse a linear, ease or spring animation halfway through, at 0.25 s of 0.5 s, and no jump showed in the values the probe printed. The probe printed the mean change for each 4 ms before and after the reversal. For linear it halved (0.0065 then 0.0032); for ease it stayed about 0.011 either side. These are means over a stretch that I did not record, not single steps, since the Mac writes only about 31 times in half a second. What these means say about additive combination or a restart depends on how long the stretch was, and the answer flips with its length, so I draw no conclusion about either from them. I also read unsigned steps, so I could not separate “speed kept” from “restarted at a similar speed” either. That test only printed and was not committed, so it is a note of one run, not a rule. I did not test it on iOS. The spring was tested, but I give no step sizes for it beyond “small and continuous”.
What I got wrong
Reading the probe’s own work back, I made seven mistakes worth listing. I read model values only, and my first iOS runs showed almost nothing happening. The motion appeared when I read presentation values too. Then I counted my own probe: reading layer.presentation() builds a copy of the layer, and building the copy calls the setters I was hooking, which gave 54 setter calls for an opacity case on the iPhone where the app made 4.
A test that fails on the case whose answer you know does not measure what you wanted. I first tested the blocked main thread by reading presentation values from a background thread. It said UIKit’s own animation had stalled too, which I knew was false, so I dropped it. I also moved a threshold after seeing the data, from 20 different values to 10, because two iPhone cases in an earlier run fell at 19 and 20 on a screen that reports 120 Hz. It changed those two verdicts only, and in the run shown in this issue the lowest count is 22, so the move changes none of the verdicts here.
flowchart LR
  test["a blocked-thread test<br/>by reading presentation<br/>values off-thread"] --> bad["it said UIKit<br/>stalled too"] --> drop["the test is dropped"]
I guessed that the 72-byte message carried a layer’s properties. Decoding it showed it does not. And I believed each per-frame message carried the shared-memory port. Capturing the messages showed that port travels only in the rare large message; the small ones carry a voucher, and the 84-byte ones a send-once reply right, and I read the extra port releases the render server does as the reply rights and vouchers of the small ones (my reading, not observed directly).
flowchart LR
  guess["guess: the 72 byte<br/>message holds layer<br/>properties"] --> decode["decoded: a transaction<br/>record with no commands"]
  guess2["guess: the shared<br/>memory port in<br/>every message"] --> cap["captured: that port is<br/>in the rare large one"]
And in my first post on this I said “about 50 messages” for SwiftUI on the Mac. That number came from my first probe’s stand-in test, which writes at 30 a second. I never counted real SwiftUI messages on the Mac.
flowchart LR
  claim["about 50 messages<br/>on the Mac"] --> src["a stand-in test<br/>writing at 30 a second"] --> fix["never counted<br/>for real SwiftUI"]
What I do not know
I do not know why SwiftUI works the value out itself at each time, on a thread of its own, instead of handing a description to the render server as UIKit does, or why the Mac differs from the iPhone. No source I have says. I do not know why the iPhone’s render server counter reads about 60 frames a second in every run, including with my app idle, why the real iPhone’s offset case had more callbacks and flushes than the simulator’s (its UIKit control also has a raised offset, and, unlike SwiftUI, a raised rotation, with no callbacks or flushes, so my reading is that the offset bump is not specific to SwiftUI, and I have no cause), or whether the render server reads the shared-memory values on every frame: I read its code and could not run it under a debugger.
flowchart LR
  q1["why SwiftUI works<br/>the value out<br/>itself"] --- q2["why the Mac<br/>differs"] --- q3["why the iPhone<br/>counter reads 60"] --- q4["does the server read<br/>every frame"]
Also open: where the last double in each frame’s transaction record comes from, what the Core Animation command code 27, which SwiftUI’s thread adds with no payload, is called, and why a modifier has three records. Not tested: how an interruption behaves on iOS; scaleEffect and rotationEffect with the main thread blocked, on any platform; transitions, matched geometry, keyframe and phase animators, Canvas and TimelineView, and views drawn by Metal with drawingGroup. The Mac numbers in this issue come from macOS 27.0.1; the stacks of the Mac inspection name Witness.debug.dylib, so that run was a Debug build, and I did not record the build of the run behind the tables. I rebuilt the probe in Release and ran it on macOS 27.2.1: the verdicts were the same (all 20 SwiftUI cases appWrites, 6 AppKit cases renderServer (one animation added to the layer and nothing writing it on every pass), and the custom animation stalled with 0 callbacks inside the blocked half second). That checks the probe’s own verdicts, not the screen recording of the dot, which I did not repeat.
flowchart LR
  tested["tested:<br/>5 properties<br/>4 kinds"] --- untested["not tested:<br/>transitions<br/>matched geometry<br/>keyframes<br/>Canvas"]
The probe, the recordings and the decoded bytes are in a private repository for now. The numbers about the 20 cases, the screens, the shared memory, the messages and the render server come from its result files. The code is the probe’s own, except the Core Animation sketch, which I wrote for this issue to show the public API, and the two charts marked as drawn from a definition or from code, which are not recorded data.
If your own measurements disagree on any platform or build, I want to see them. A different answer on a different OS version is the most useful report I can get.
Mihaela
The shorter version, with the dot charts and the recordings: https://aleahim.com/blog/how-swiftui-animates/